Prediction of electron density and pressure profile shapes on NSTX-U using neural networks
Nuclear Fusion 61 046024 (2021)
Princeton Plasma Physics Laboratory
Carnegie Mellon University
Princeton Plasma Physics Laboratory
Carnegie Mellon University
Princeton Plasma Physics Laboratory
Carnegie Mellon University
Abstract
A new model for prediction of electron density and pressure profile shapes on NSTX and NSTX-U has been developed using neural networks. The model has been trained and tested on measured profiles from experimental discharges during the first operational campaign of NSTX-U. By projecting profiles onto empirically derived basis functions, the model is able to efficiently and accurately reproduce profile shapes. In order to project the performance of the model to upcoming NSTX-U operations, a large database of profiles from the operation of NSTX is used to test performance as a function of available data. The rapid execution time of the model is well suited to the planned applications, including optimization during scenario development activities, and real-time plasma control. A potential application of the model to real-time profile estimation is demonstrated.
[.pdf] [publication] [poster] [slides]About
In the summer of 2020, I worked with Dan Boyer at the Princeton Plasma Physics Laboratory (PPPL) to create a neural network for predicting fusion plasma properties in real time. This is useful for real-time control systems, which need an accurate approximation of the current state of the system in order to optimally control it. Existing physics-based methods (TRANSP) are very accurate but also orders of magnitude too slow to be useful for real-time state estimation.
The neural network has access to 9 input variables corresponding to instantaneous values of the plasma at a given time. These variables include plasma current, upper and lower triangularity (measures of the shape of the plasma), and others. The goal of the network was to predict a sequence of values corresponding to the density and pressure of the plasma at many radial points from the center to the outer edge through the central plane of the toroidal plasma.
To recreate the conditions in which a neural network like this would actually be used, we also evaluated the model’s ability to predict shots chronologically (i.e. when predicting shot $x$, only train on all shots before shot $x$).
I presented a poster on my preliminary results at the 2020 APS DPP meeting and the work later was published in Nuclear Fusion.
Selected Figures
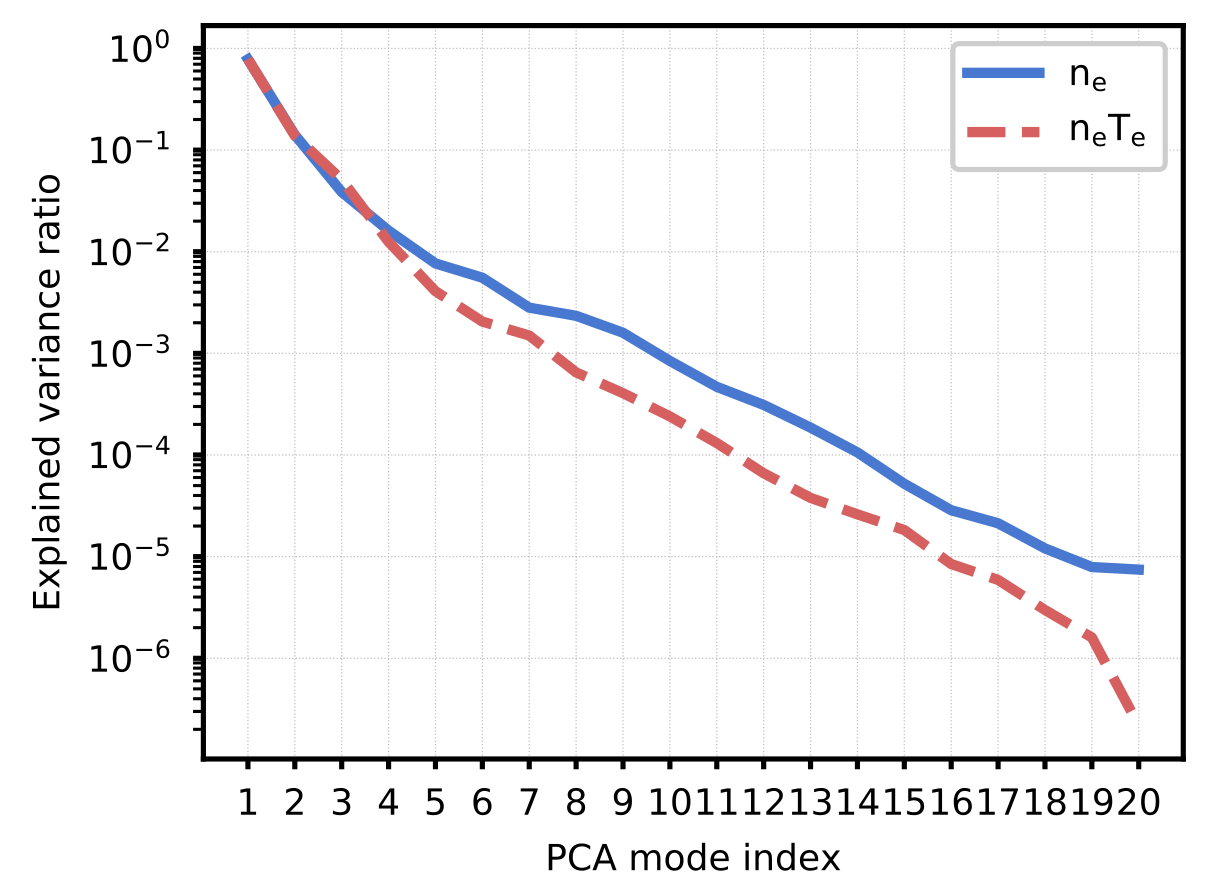
Figure 1. Relative explained variance of principal components for the NSTX-U training data. We use principal component analysis (PCA) to reduce the dimensionality of the density and pressure profiles. In this work, modes with an explained variance ratio greater than $10^{-3}$ are kept. This leads to keeping 7 modes for the pressure profile shape and 9 for the density profile shape.
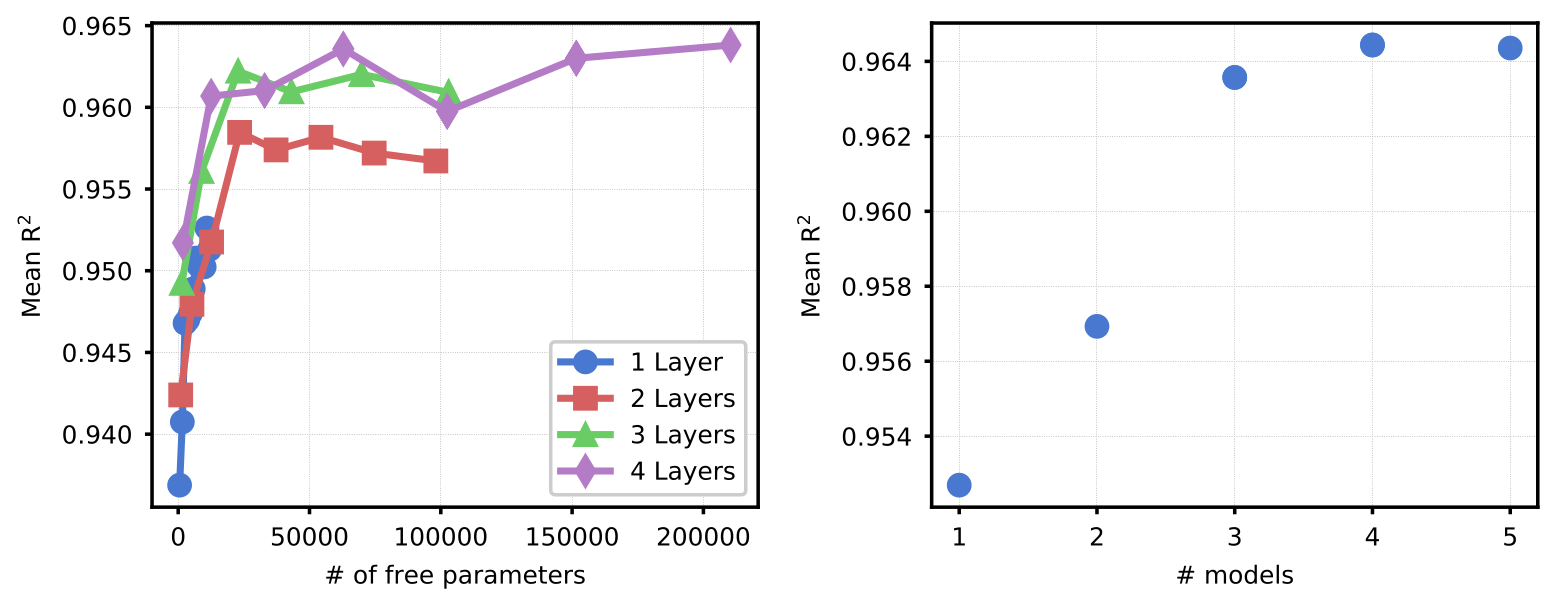
Figure 4. Determining optimal number of NN layers and ensemble size. (left) Model prediction accuracy (on the NSTX-U validation dataset) across potential architectures. Each model consisted of a varying number of hidden layers, each with the same number of nodes per layer. An ensemble of 3 models was used for each case. (right) Prediction accuracy (on the NSTX-U validation dataset) as a function of number of models in the ensemble (for model with 4 layers of 140 nodes each).
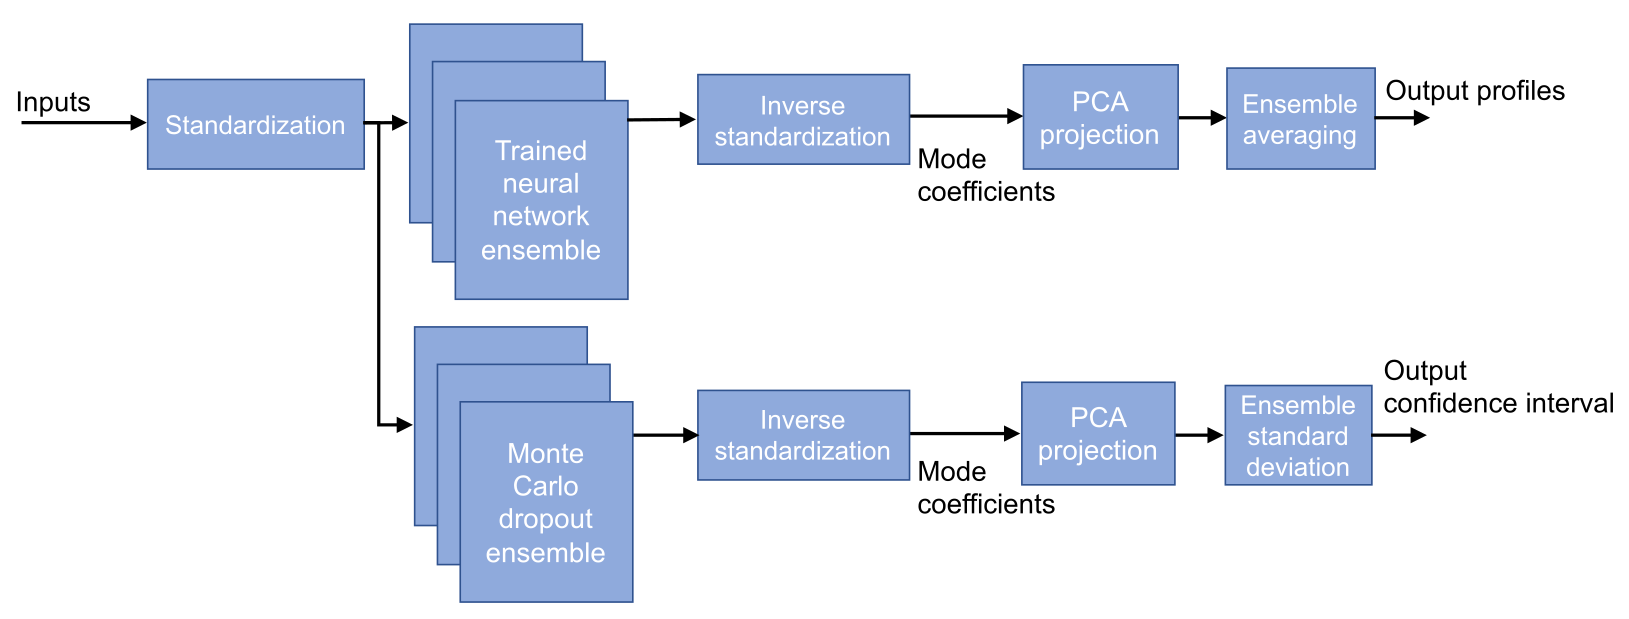
Figure 5. Overview of the proposed model including ensemble averaging and uncertainty estimation.
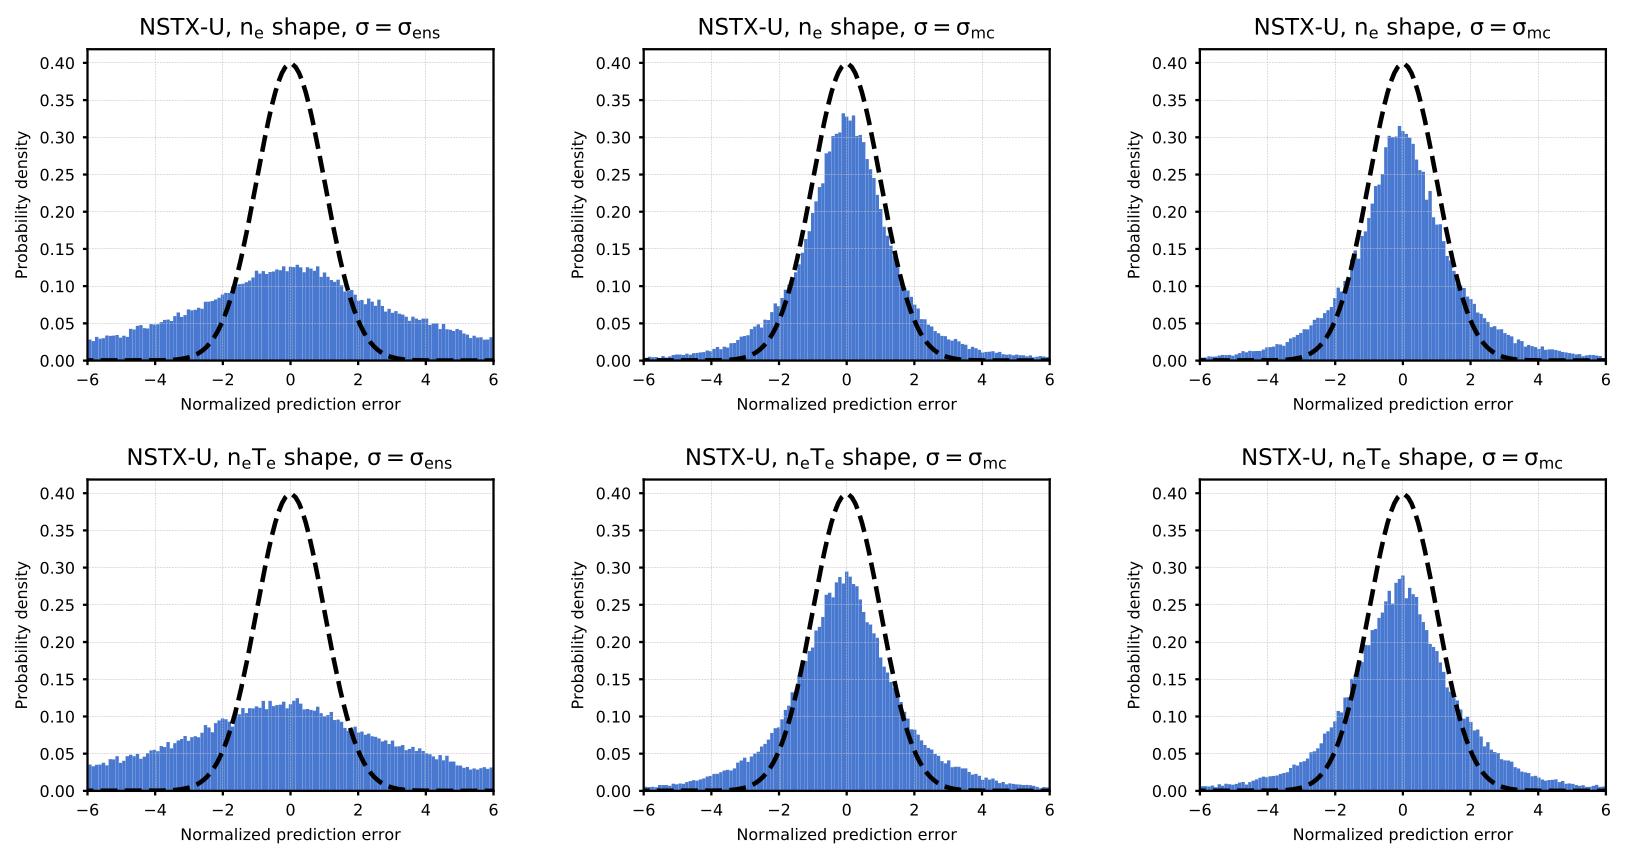
Figure 6. Probability density of prediction errors (normalized by uncertainty estimate) for ne (top) and ne T e (bottom) profile shapes. The left column shows results calculated on the validation dataset with the standard deviation of the ensemble of trained model predictions as the uncertainty estimate. The middle column shows results calculated on the validation dataset with the standard deviation of the Monte Carlo dropout ensemble predictions as the uncertainty estimate. The right column shows the results for the Monte Carlo case evaluated on the test dataset. A reference normal distribution (mean = 0, standard deviation = 1) is shown as a black dashed line.
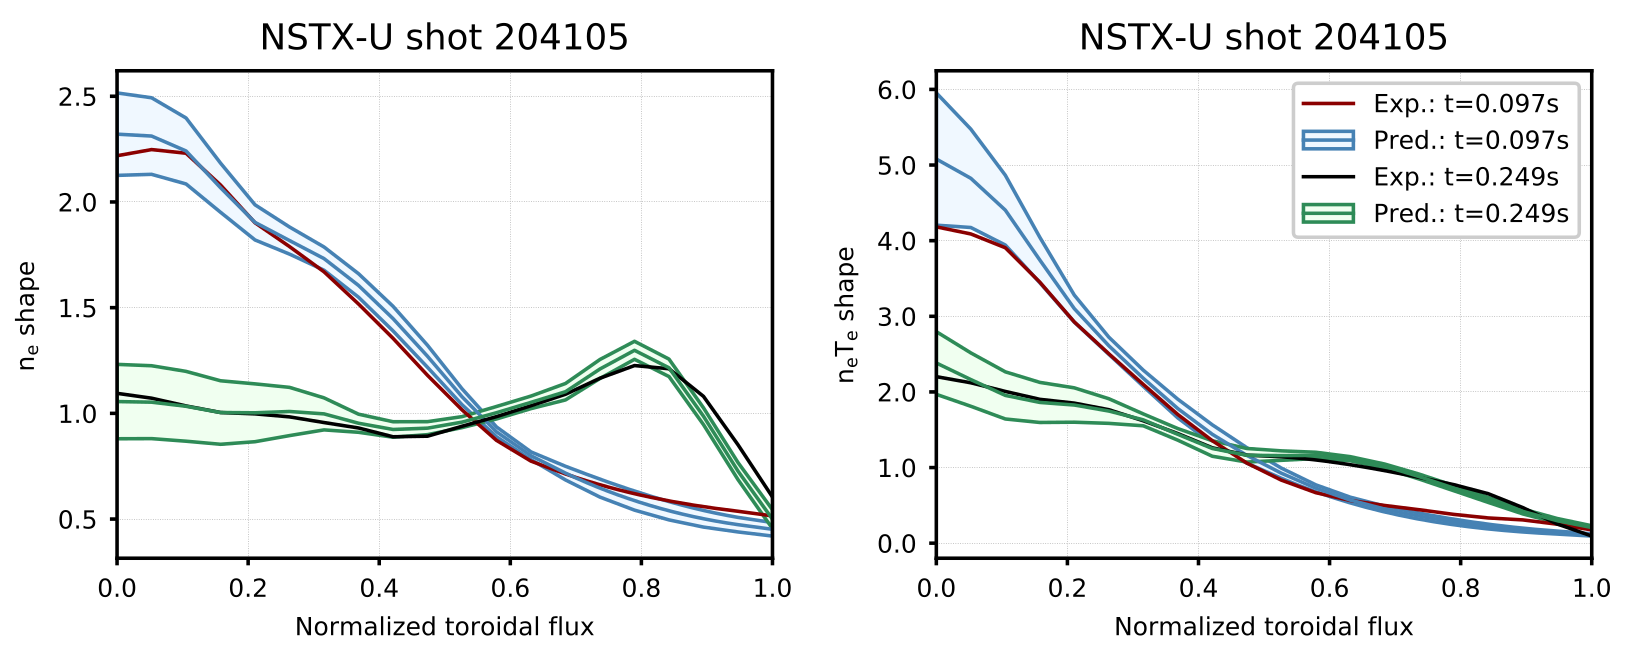
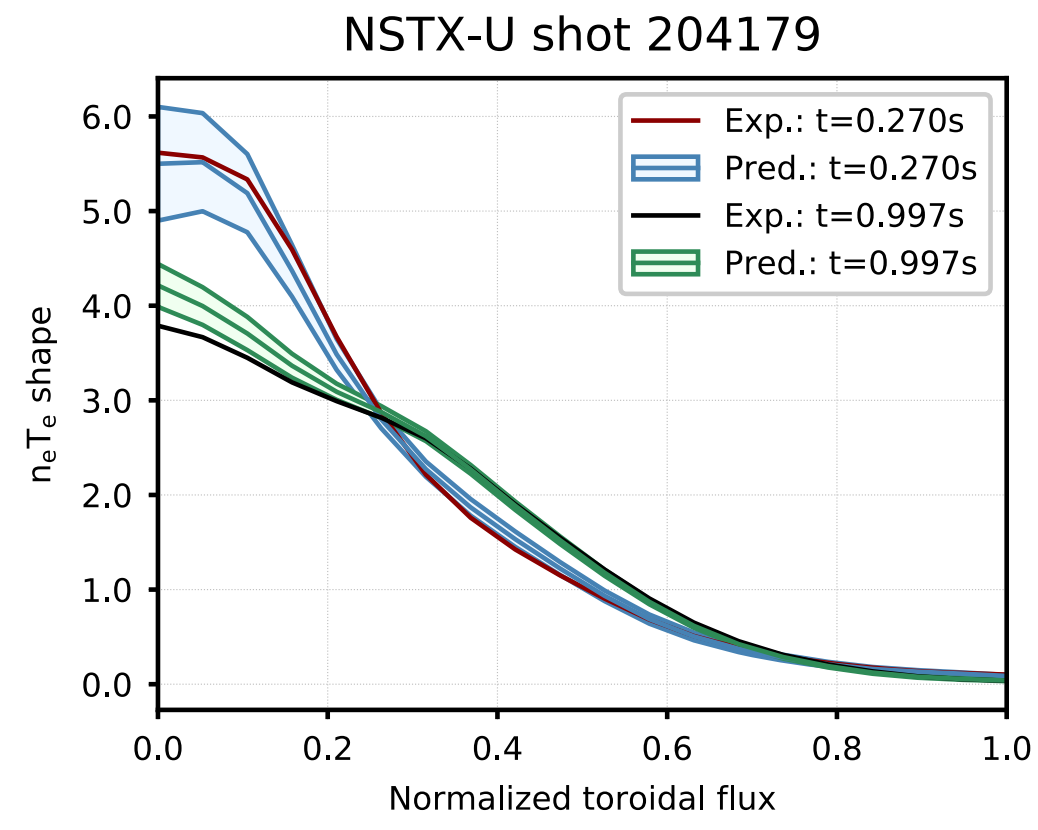
Figure 9. Comparison of profiles predicted by the model (shaded region represents $\pm$ one standard deviation of the Monte Carlo dropout ensemble) to the expected profiles for shot 204105. This shot was in the testing dataset (not used in training or topology selection).
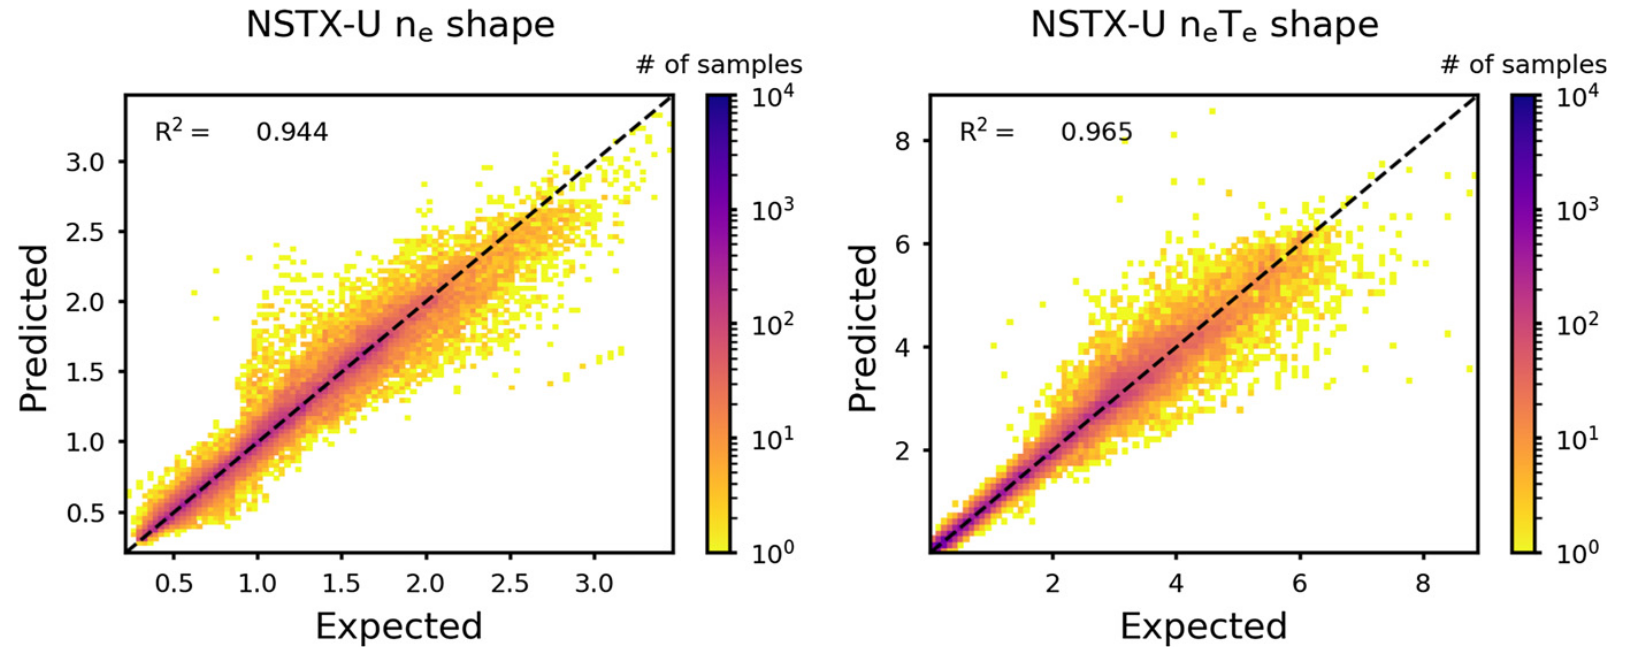
Figure 10. Log-scale histograms of regression results for the testing data set for electron density and pressure profile shapes (includes all radial locations). Results shown for 4 layers, 140 nodes.
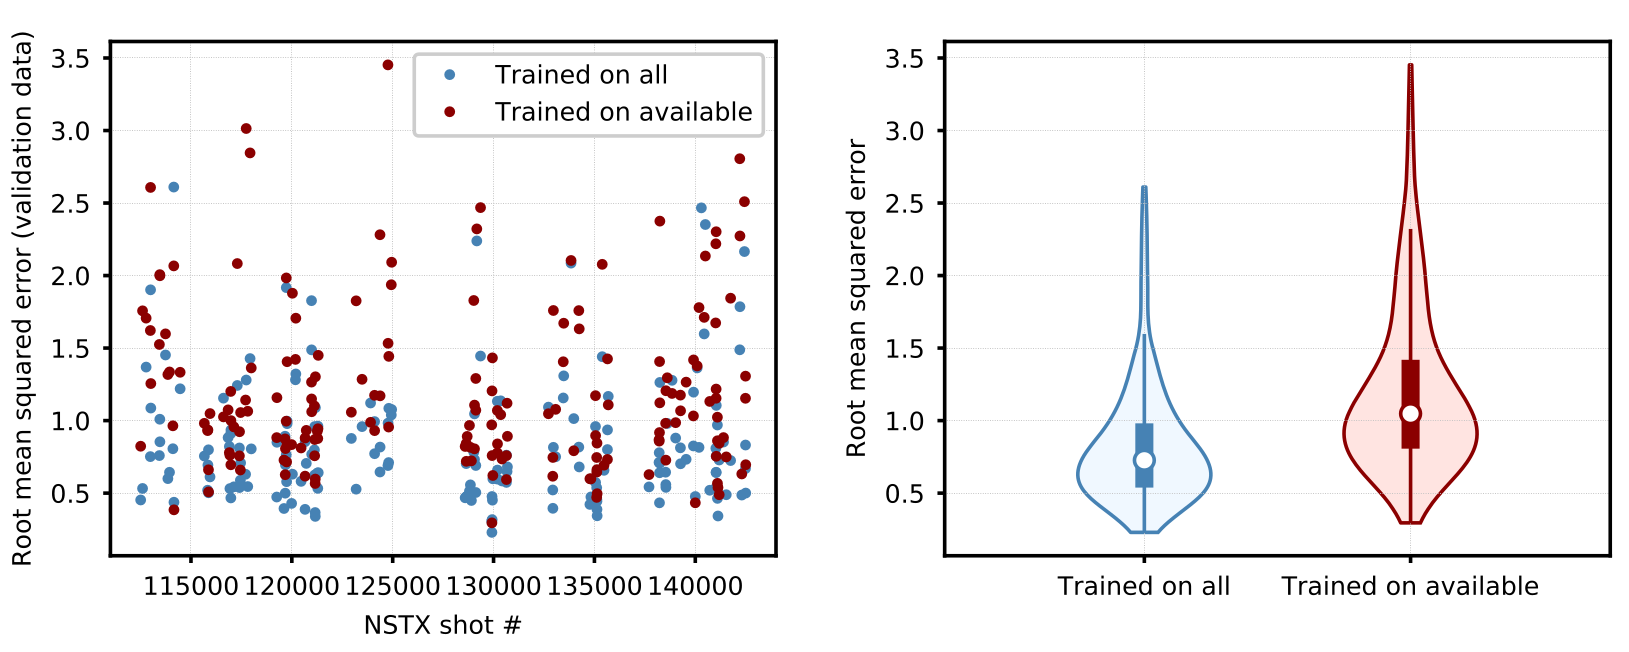
Figure 17. (left) Model prediction errors for NSTX validation shots using the latest available online learning model compared with the model trained on all NSTX training shots. (right) Distribution of results for both cases (shaded regions). In these plots, white dots indicate medians, thick lines indicate the interval between first and third quartiles, and thin lines represent the interval between lower and upper adjacent values. Median prediction error increases when predicting based on available data and the worst predictions, while rare, are significantly worse than for the model trained on all data.
My Contributions
← back to jason-chadwick.com